Heat maps #
Heat map visualisation #
- Navigate to the Heat maps tab in the Maps selection
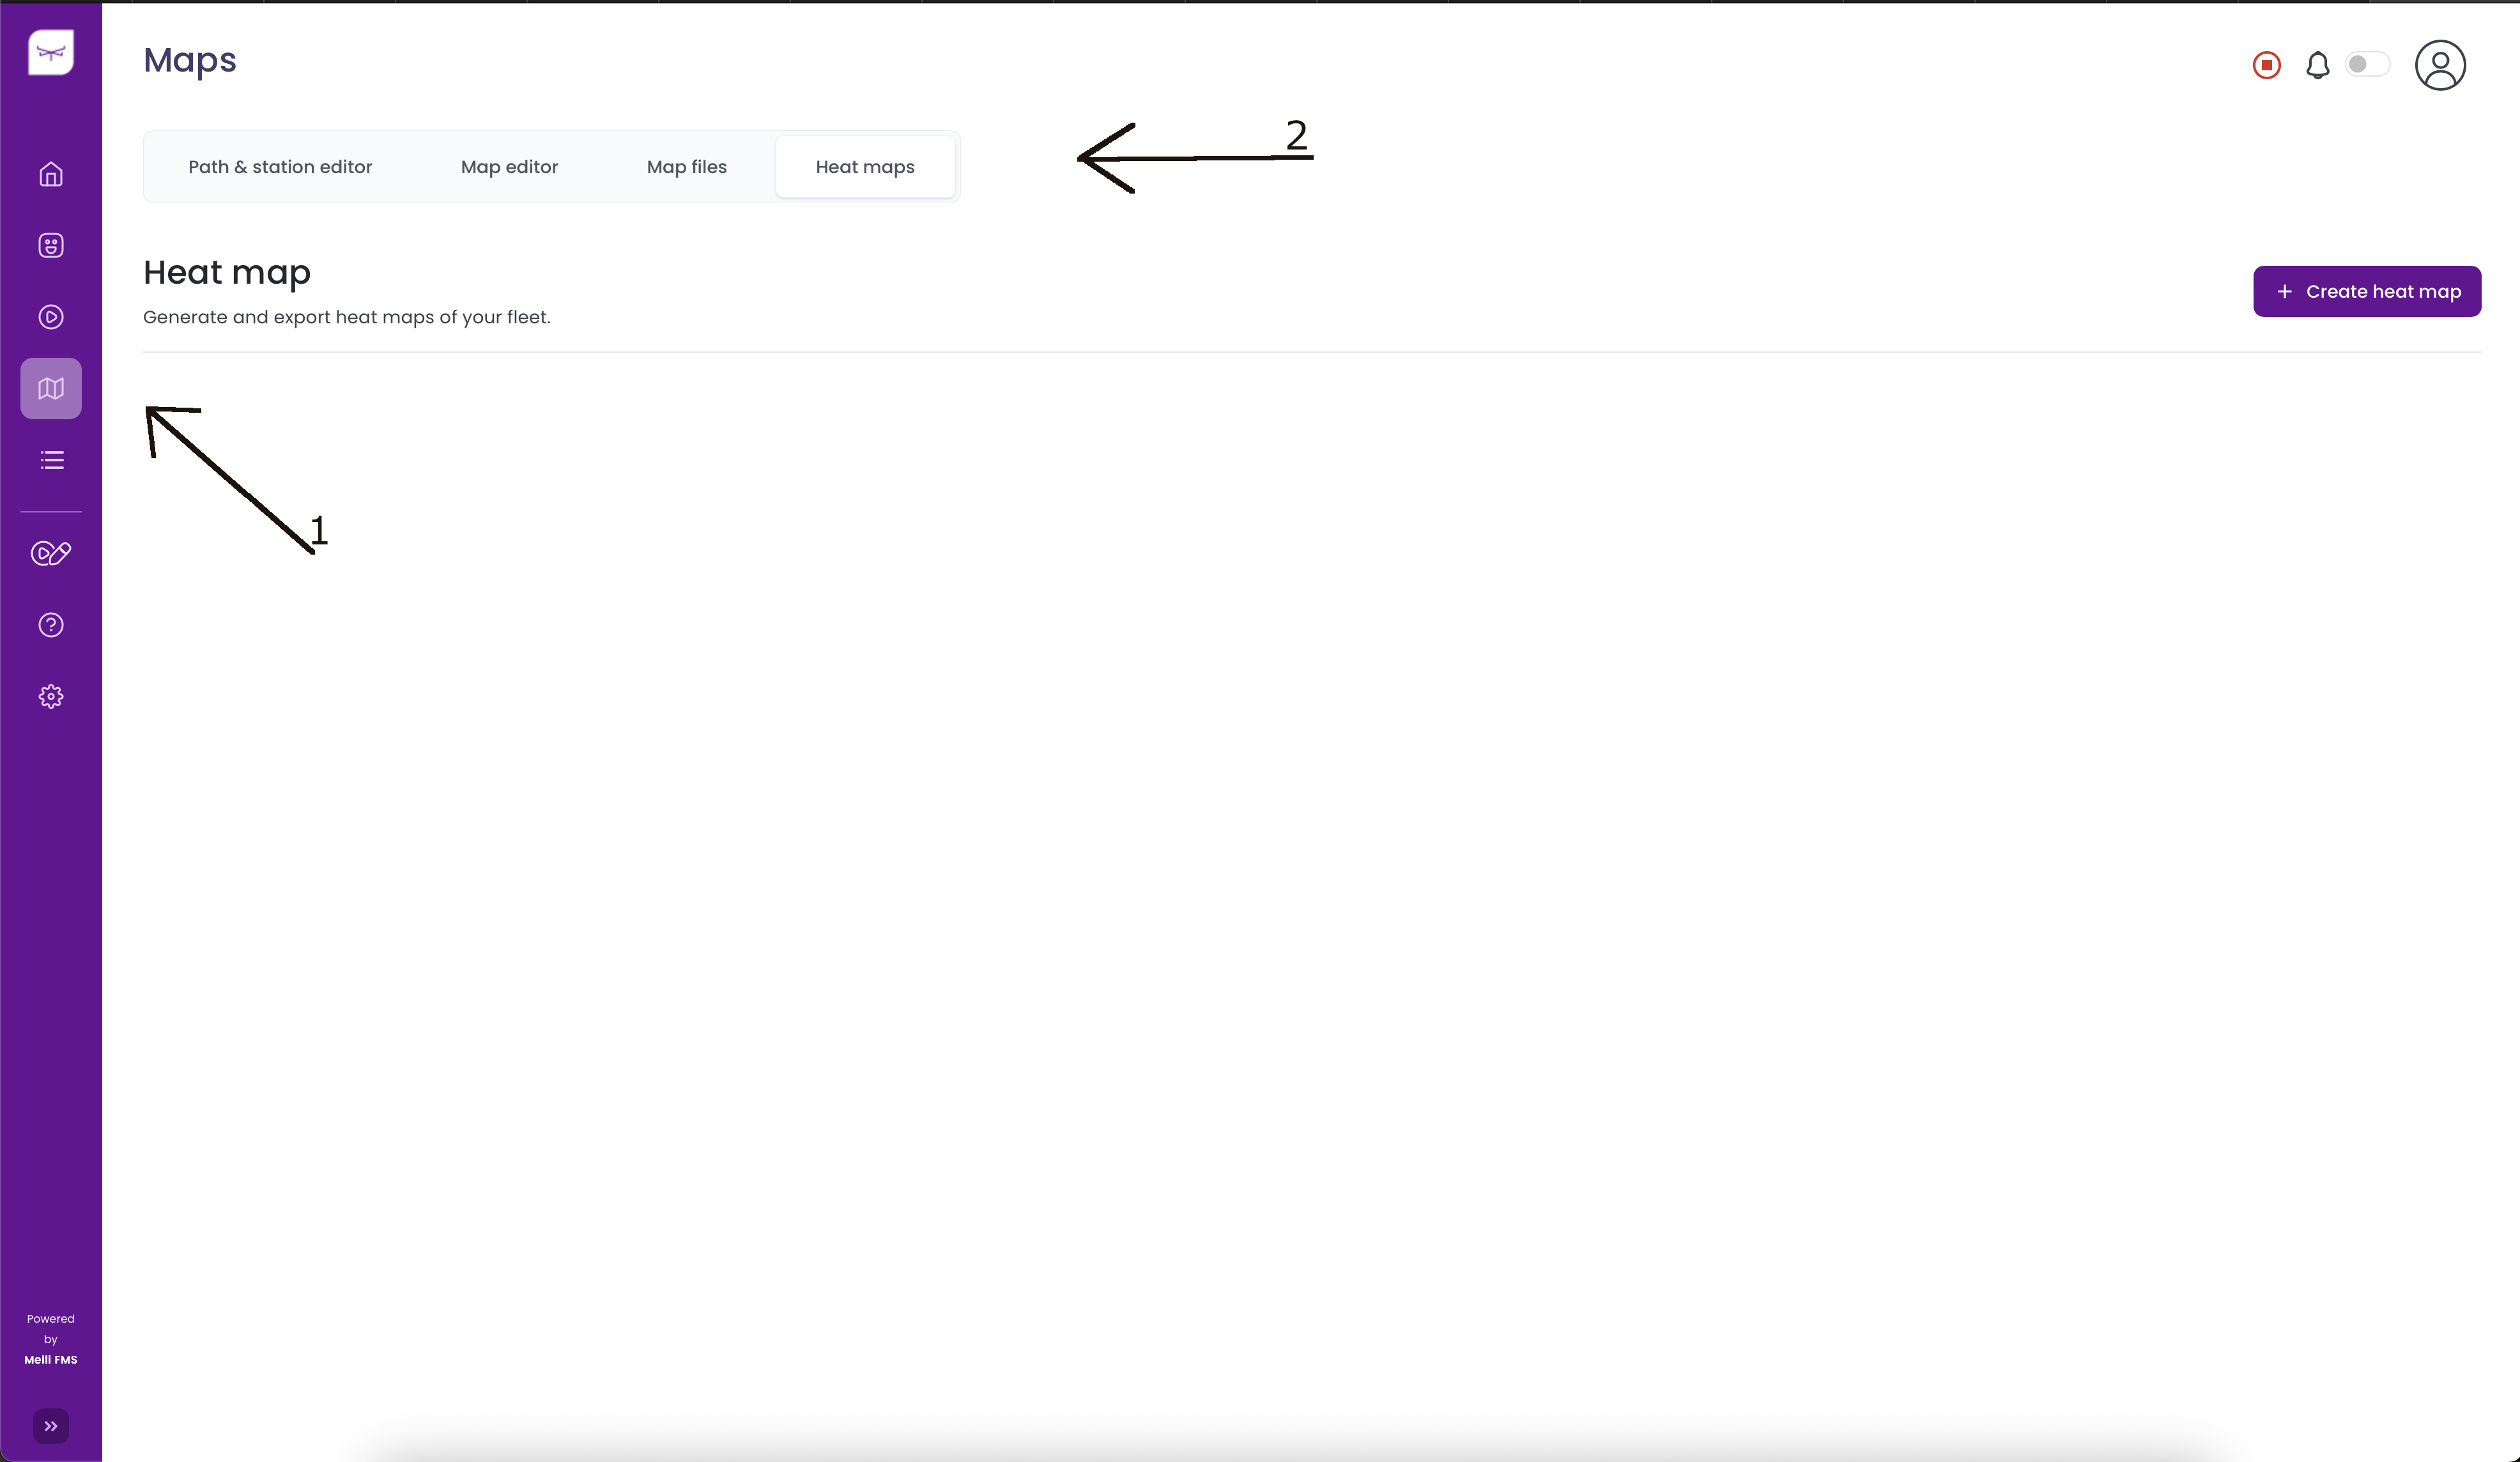
Note Here you can also view previously generated heat maps.
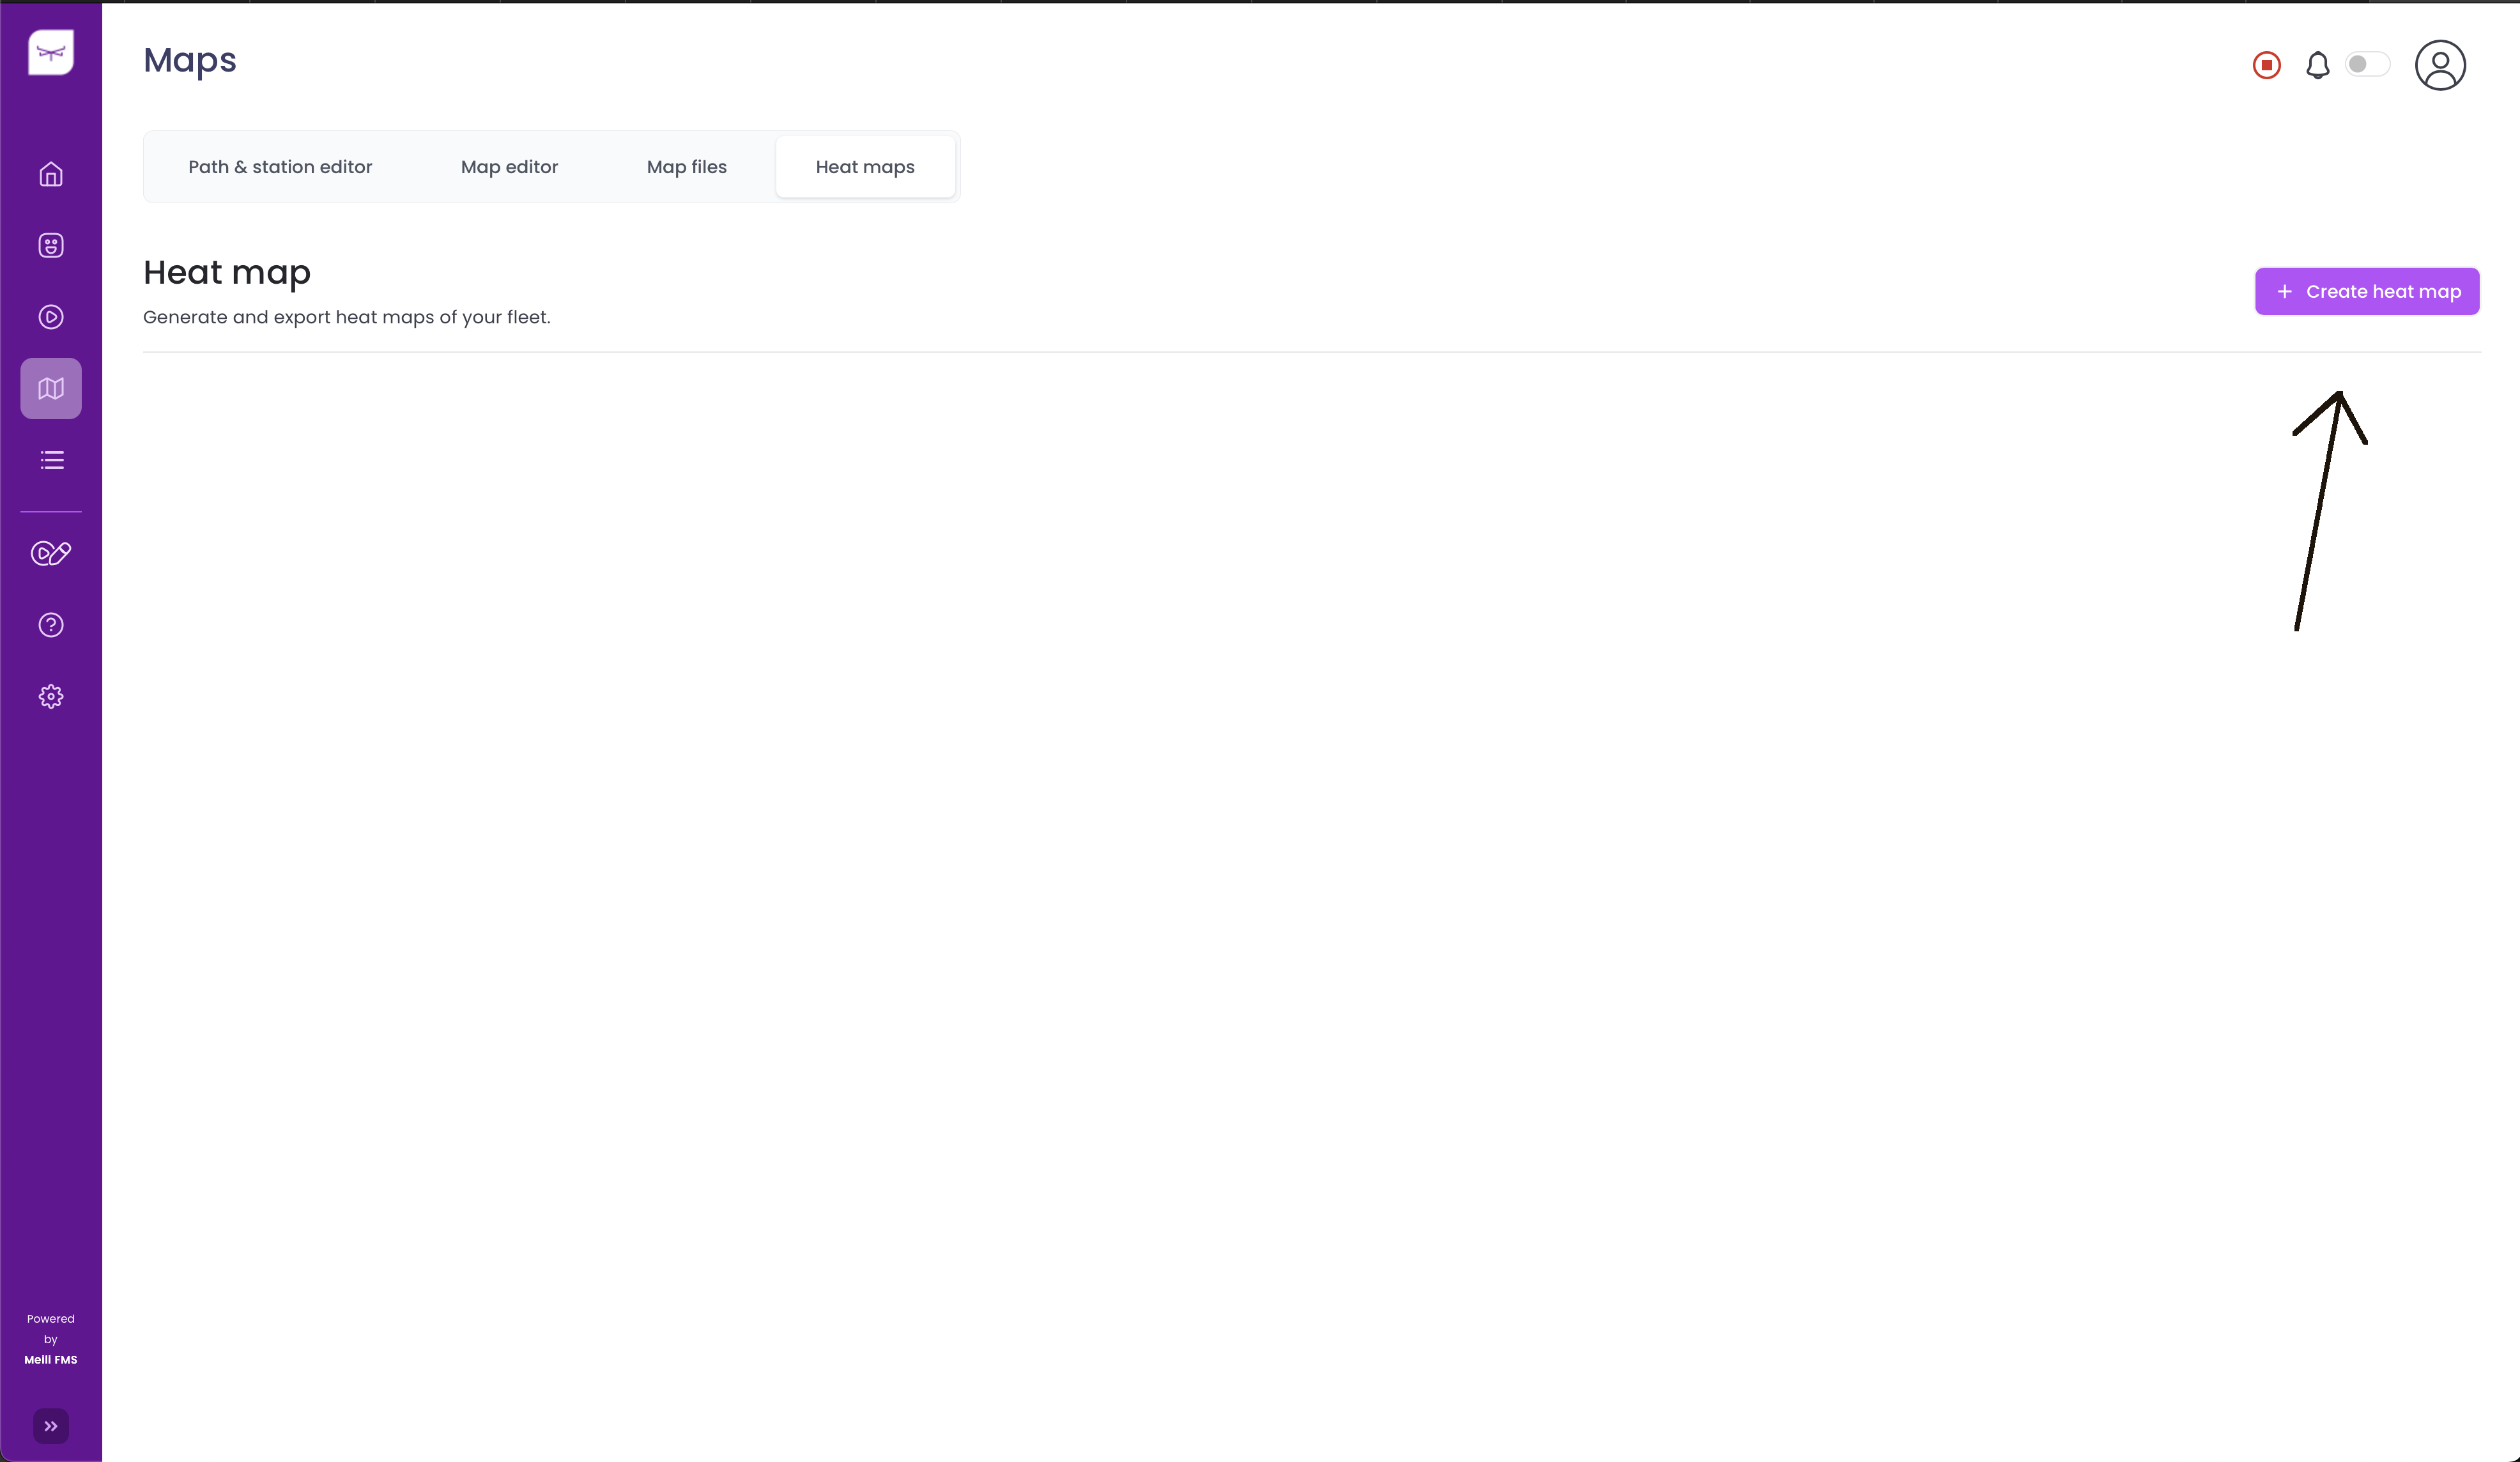
- Click on “Create heat map” button located on the right side
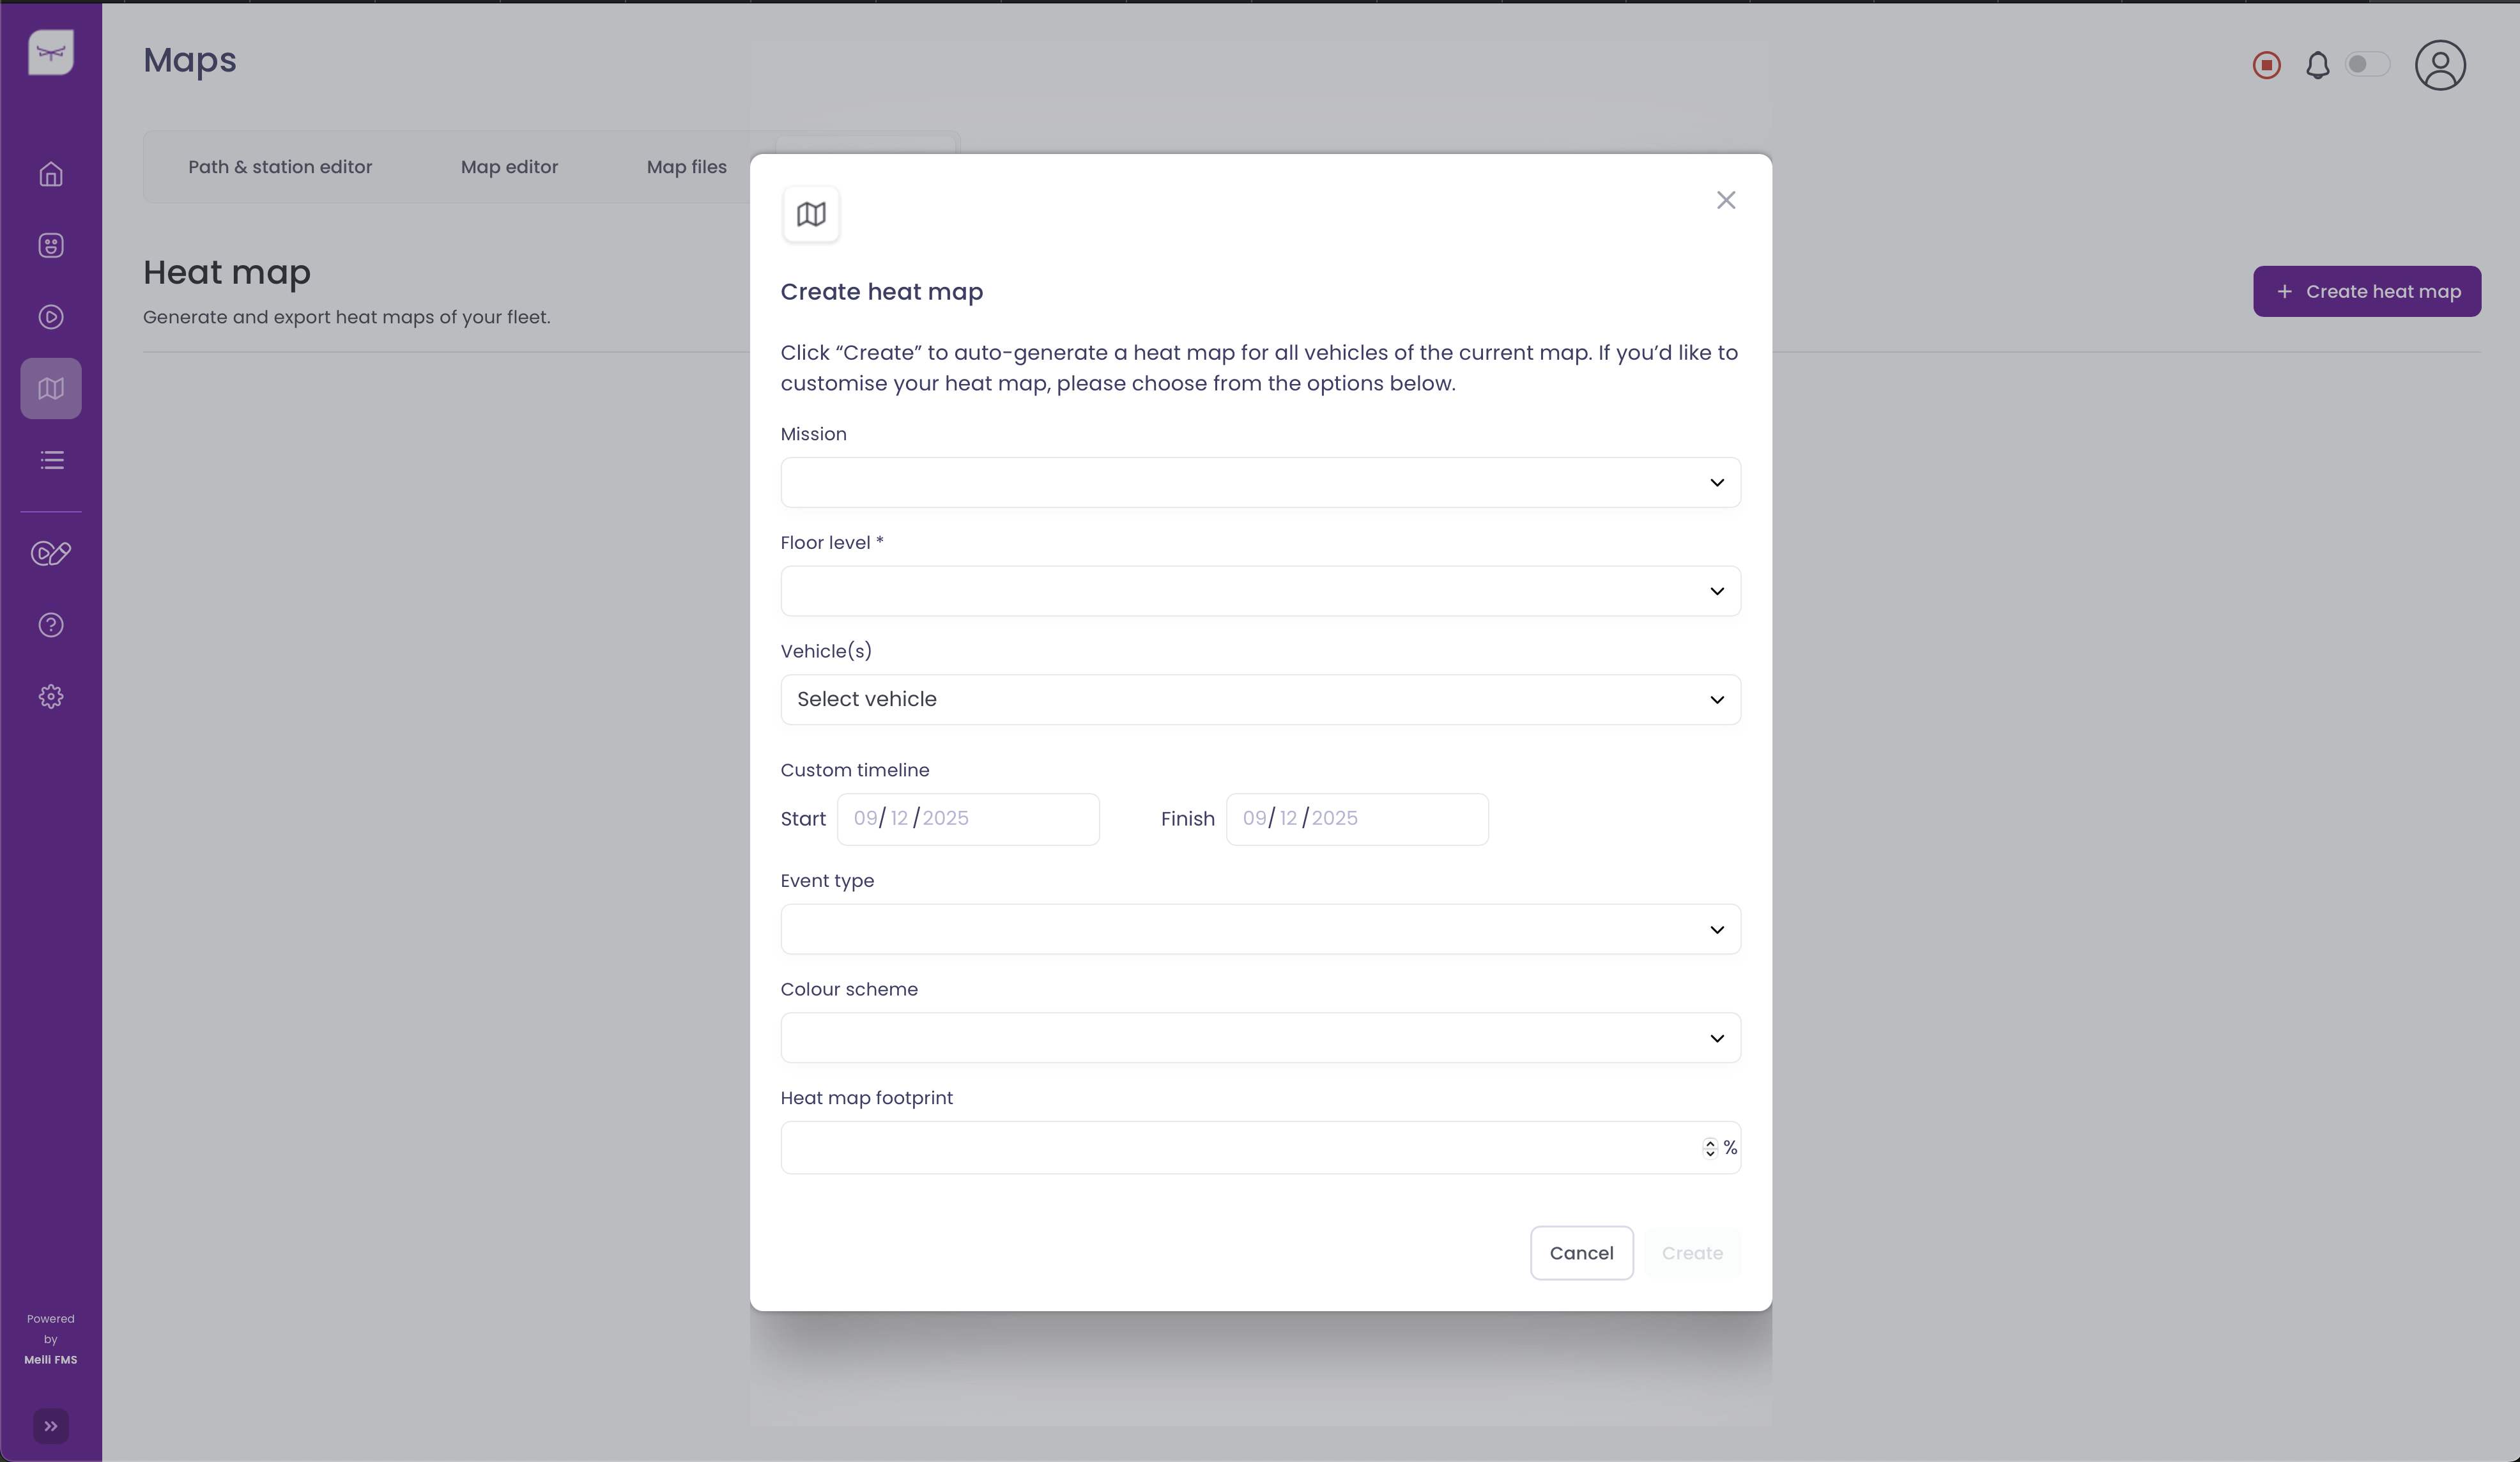
- Complete the form details. This will generate a custom heat map based on your requirements.
Heat map generation #
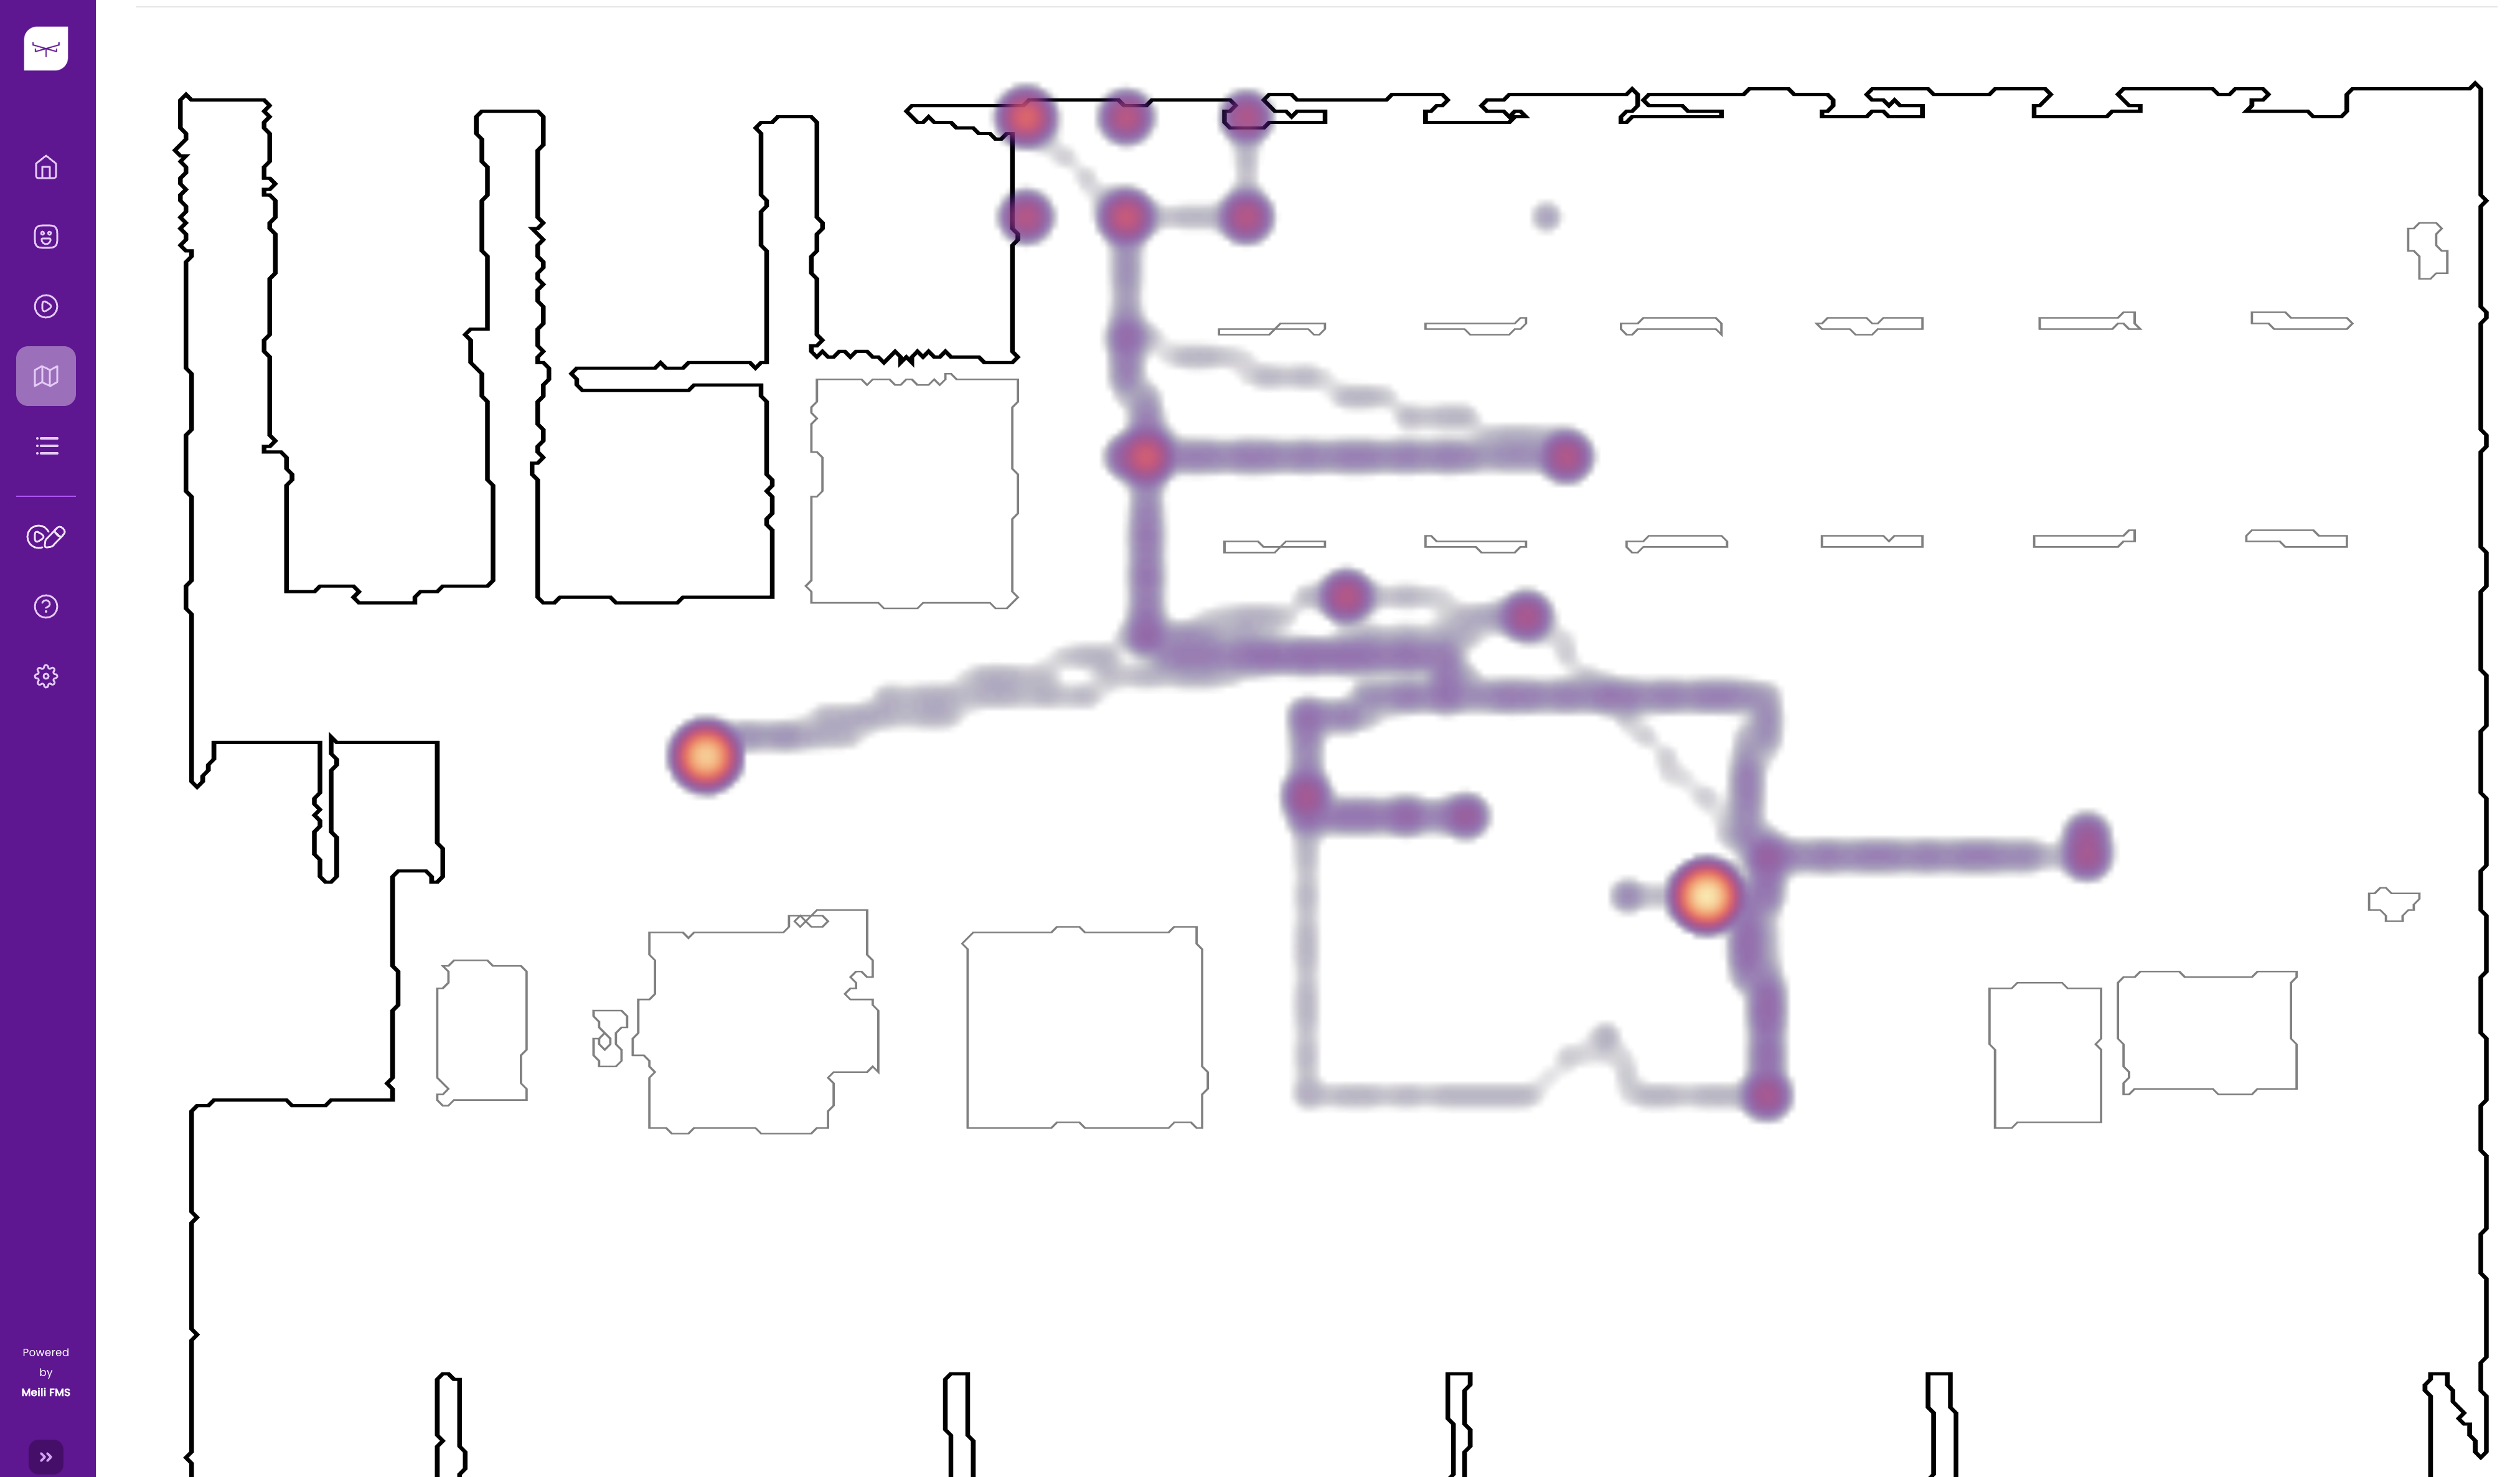
There are two main types of heat maps. Connection heat maps show where connection/disconnection events occur on the map. This is helpful to understand where internet connection might have unstable/weak points. The second type of heat maps is related to location. This shows where the vehicles spend most time, most used paths, etc. This can be used to visualise possible bottlenecks and plan for route improvements. Below you can see the description of each field found in the heat map generation popup.
- Heat map type: The type of heatmap to be generated between either a connection or location heatmap
- Name: Optional. The user can specify a meaningful name for later usage.
- Mission: Optionally, a mission from the available list can be specified, for which to generate a heat map.
- Floor level*: Heat maps can only be generated one floor at a time. Specify for which level to generate the heat map.
- Vehicle(s): An optional list of one or more vehicles, only for which the heat map should be generated.
- Custom timeline:
- Start: A starting point for the timeline (optional).
- Finish: A finish point for the timeline (optional).
- Event type (Location): Optionally select either a dynamic event (described by samples where the vehicle was moving) or static event (described by samples where the vehicle was static)
- Event type (Connection): Optionally select either a connection event (described by samples where the vehicle was attempting a connection to the FMS) or disconnection event (described by samples where the vehicle has inexplicably disconnected from the FMS)
- Colour scheme: A selection defining the colors used to generate the heatmap. Defaults to magma.
- Heat map footprint: The footprint of the points on the map (in percentage) in relation to the original map.
Heat map example #
Below is an example of the expected heatmap generation result.